.png)
How to Access Reports in eCommerce
Your eCommerce dashboard holds various reports for all the attributes of your online business. This includes sales analysis, top-selling items, etc. Read more below to learn how to access reports in eCommerce.
Table of Contents
How to Access Reports
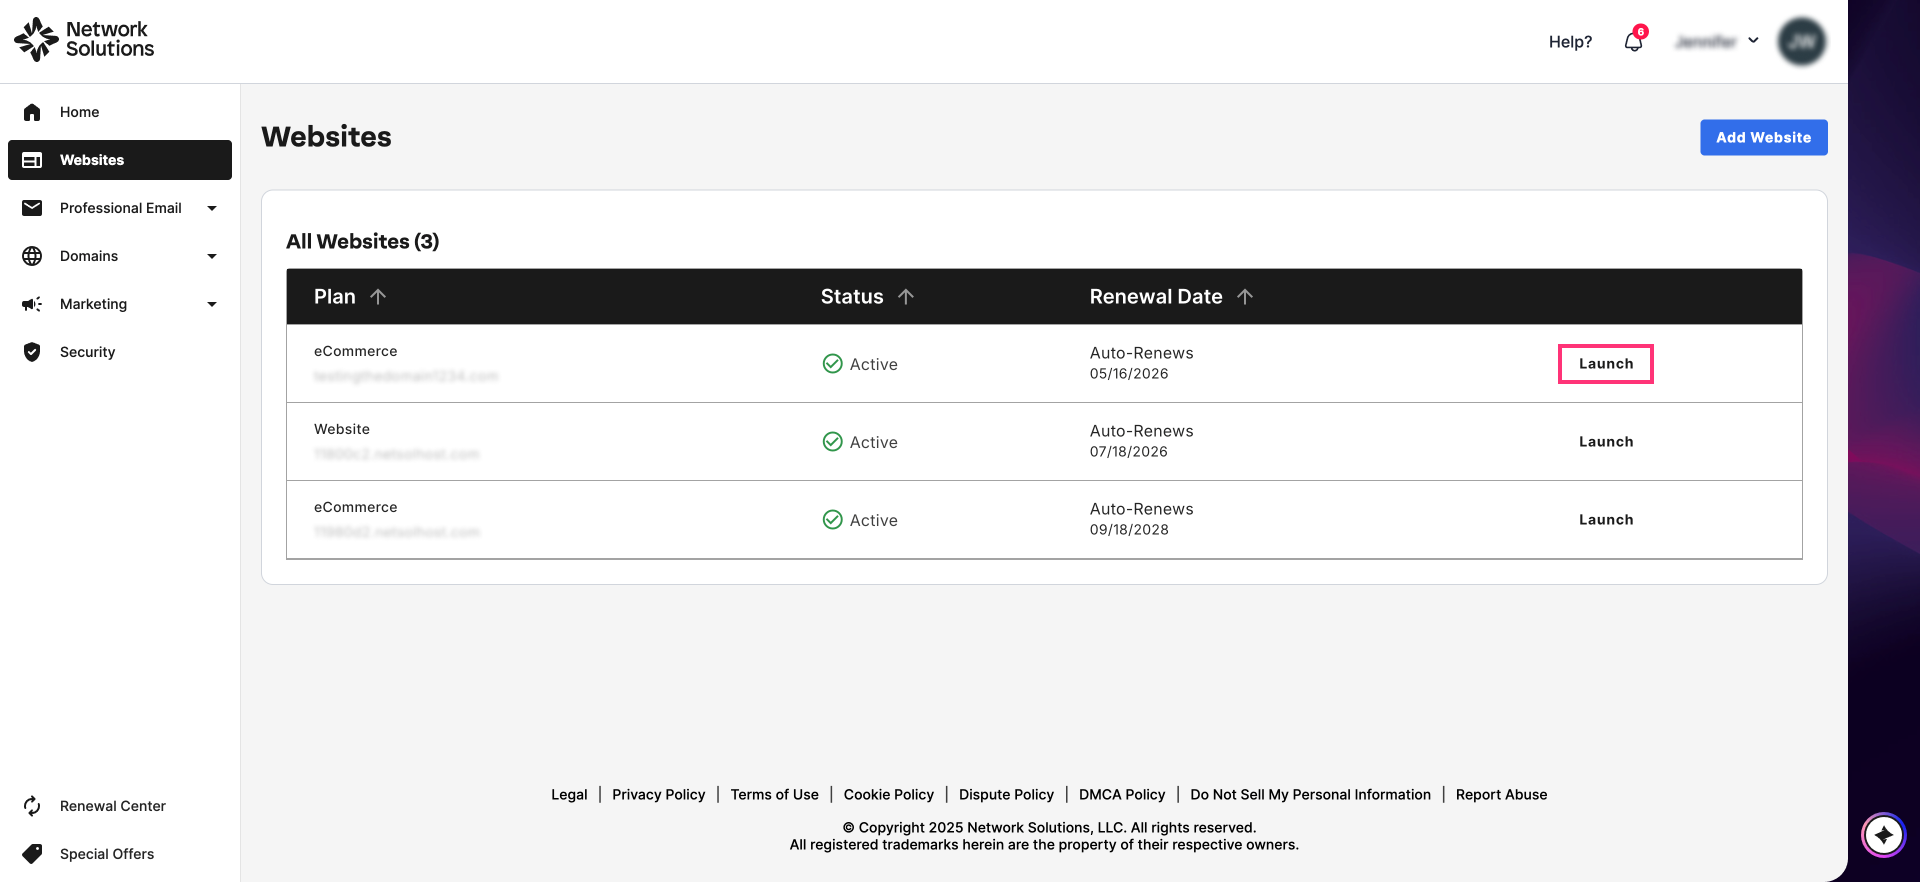
- Log in to your account via https://www.networksolutions.com/my-account/login.
- On your Account Manager homepage, click Websites on the left menu. If you only have one eCommerce product, you will be automatically routed to your Website Builder.
- If you have multiple eCommerce products, click Launch next to the product you would like to update.
- Once you have accessed your Website Builder, click Store on the left menu.

- On the Reporting page, you will see all available reports in the Reporting section.
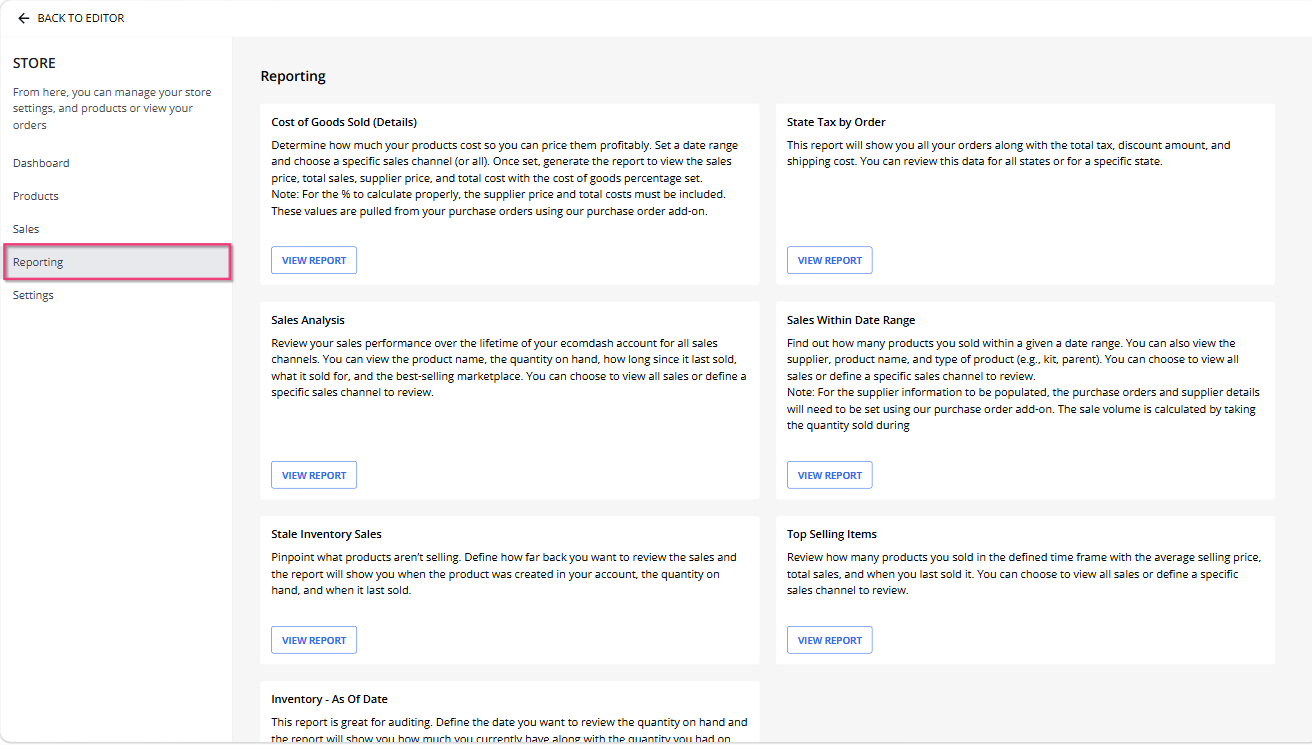
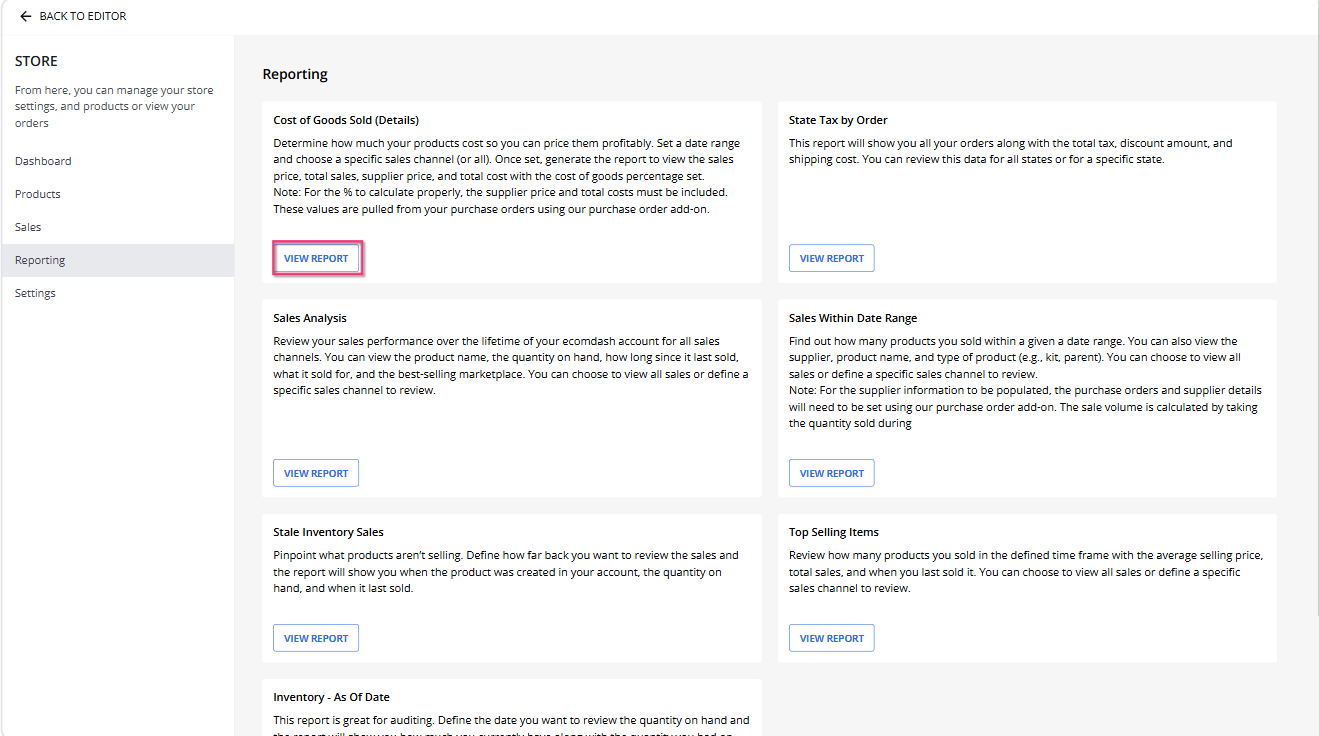
- To view the report you want to access, click the View Report button.
Here are the categories and the reports provided for your business:
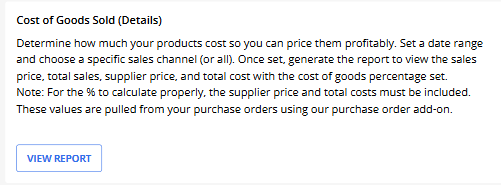
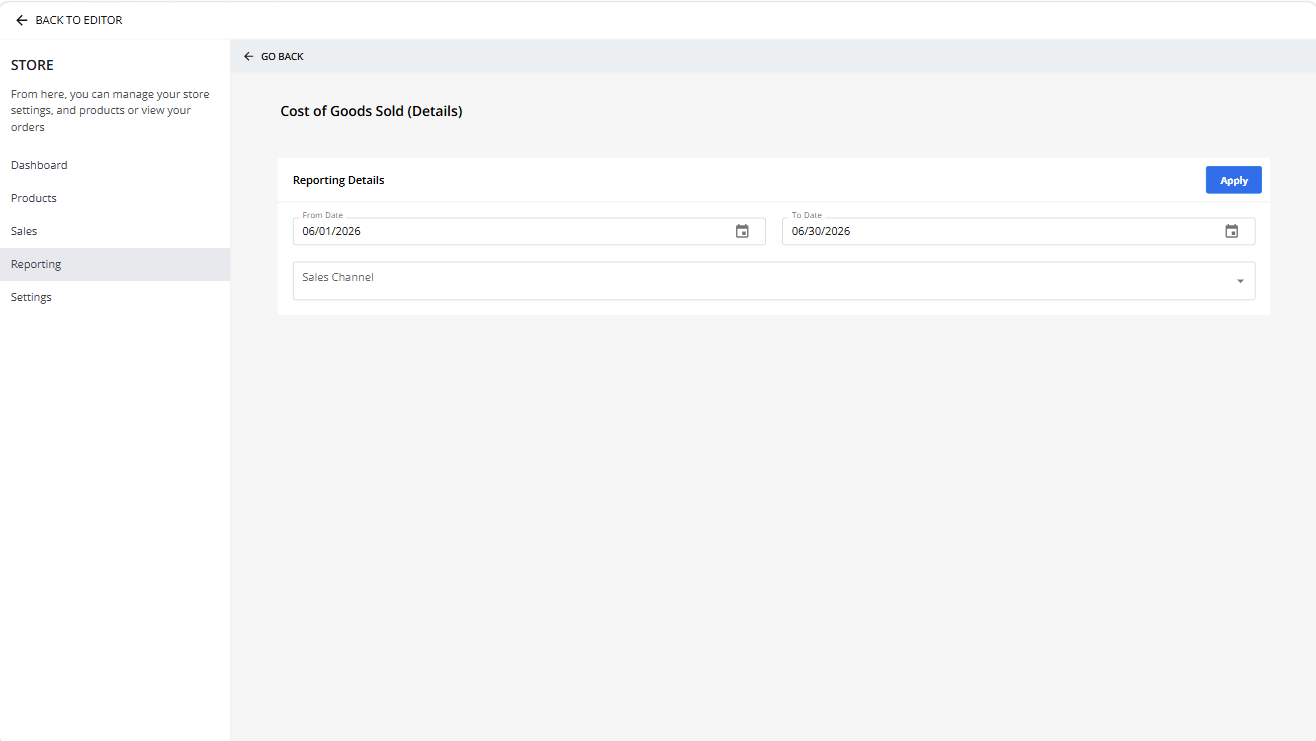
- Cost of Goods Sold (Details) - This report helps you determine your product costs for profitable pricing by analyzing sales data within a chosen date range and sales channel.
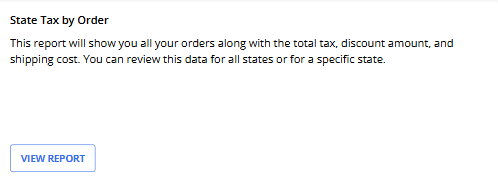
- State Tax by Order - This report provides a comprehensive view of all your orders, including total tax, discount amount, and shipping cost, with the option to filter the data by specific states.
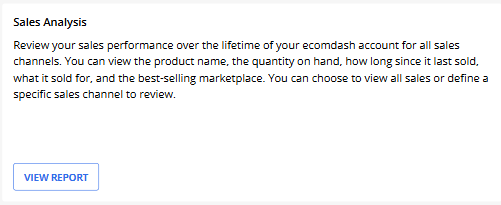
- Sales Analysis - Allows you to review your lifetime sales performance across all or specific sales channels, detailing product name, quantity on hand, last sold date, sales price, and best-selling marketplace.
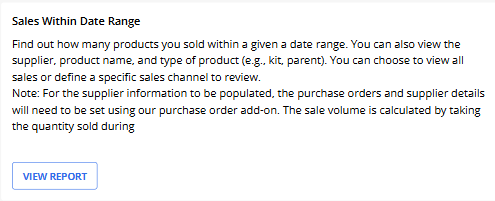
- Sales Within Date Range - shows the quantity of products sold within a specified period, along with supplier, product name, and type, with the option to filter by sales channel; supplier information requires the purchase order add-on, and sales volume is based on the total quantity sold.
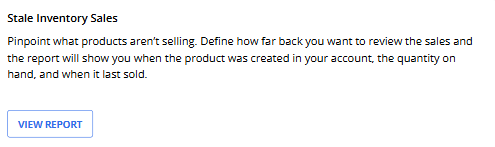
- Stale Inventory Sale - identifies underperforming products by showing when they were created, their current stock levels, and their last sale date, based on your specified review period.
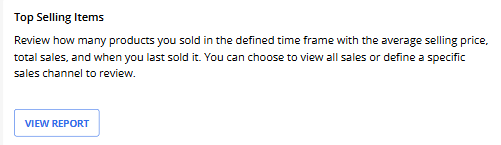
- Top Selling Items - summarizes your sales performance within a chosen timeframe, displaying the number of products sold, average selling price, total sales, and last sale date, with the option to view all sales or a specific channel.
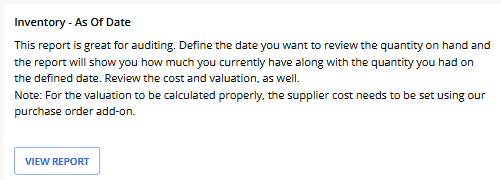
- Inventory - As of Date - This report is ideal for auditing inventory by comparing current and past quantities on a specific date, along with cost and valuation, which requires supplier costs from the purchase order add-on for accurate calculations.
- The next page will show all the parameters and other options. Set preferred parameters. Once complete, click the Apply button.
Review
Accessing reports through your eCommerce dashboard on Network Solutions is a straightforward process that can significantly enhance your business insights. By navigating to the Reporting section, you can easily view and analyze various metrics such as sales analysis, top-selling items, and inventory status.