.png)
My Analytics
Table of Contents
- Analytics Tabs
- Overview Tab
- Active Users Tab
- Popular Pages Tab
- Devices Tab
- Location Tab
- Enabling Analytics Tool in the Website Builder
The Website Builder Analytics reporting tool gives you insight into the site's performance. With Analytics, you can get a clear picture of your visitors and their behavior through visual reports on statistics like Page Views, Visits, and Unique Audience.
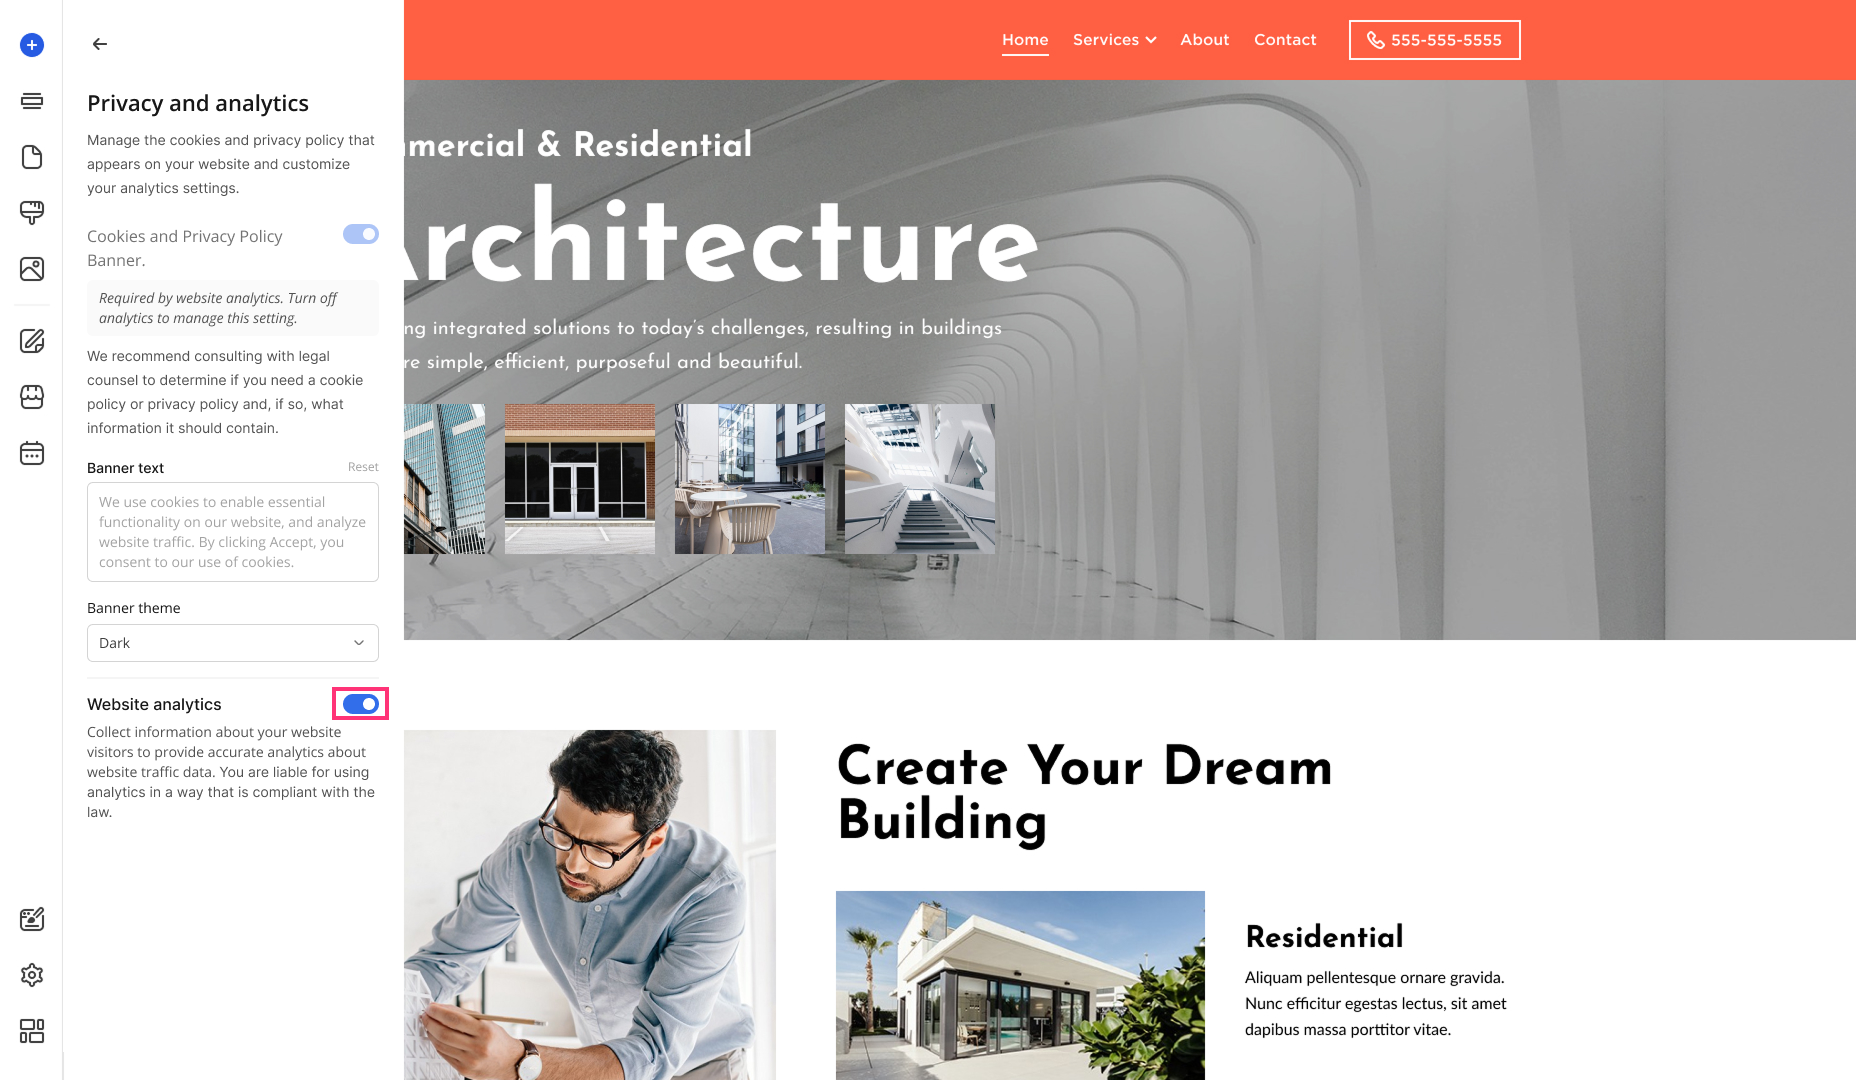
Please Note: Data is only available for published sites with enabled Website Analytics in Legal Settings and updates once a day. Select a date range of up to six months in the drop-down.
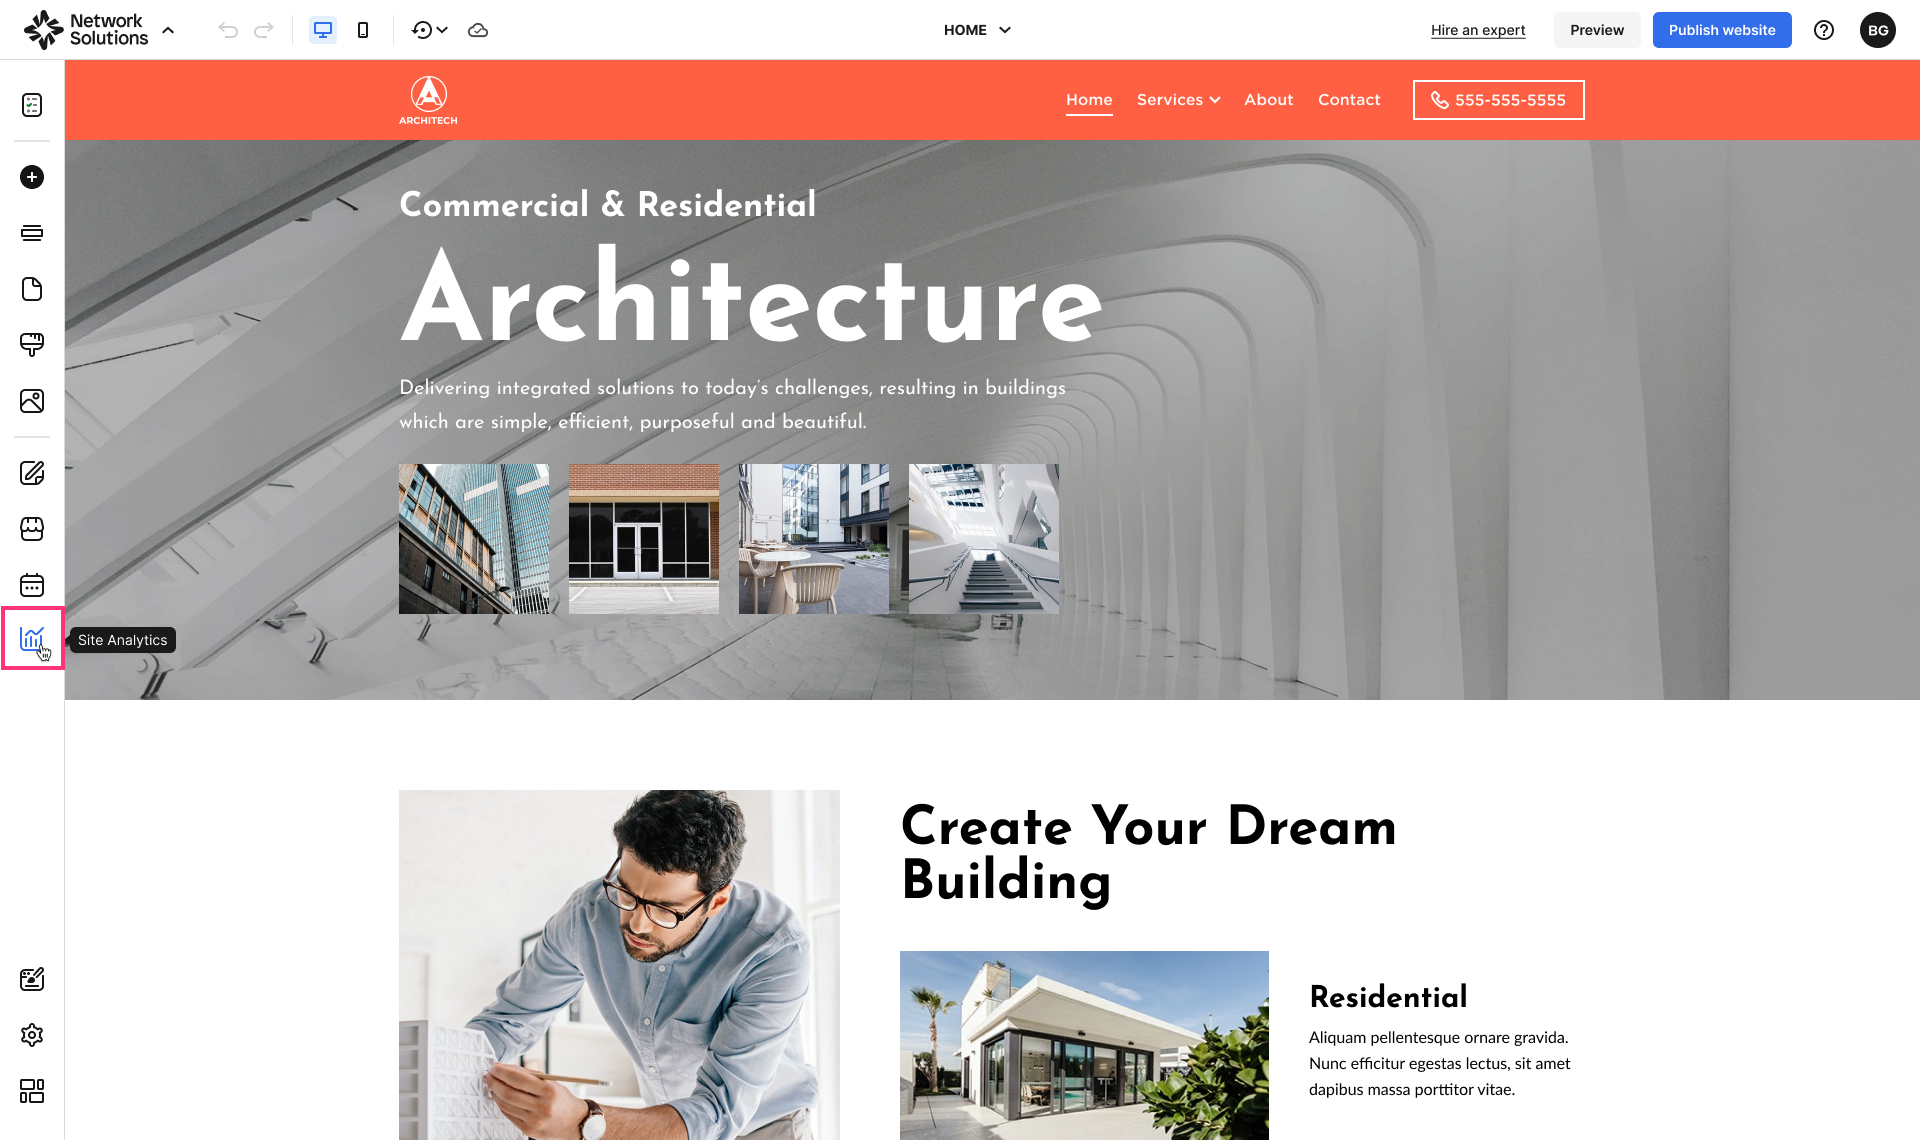
- To access the Analytics tool, proceed to the left sidebar of the Website Builder and select Analytics:
Analytics Tabs
Overview Tab
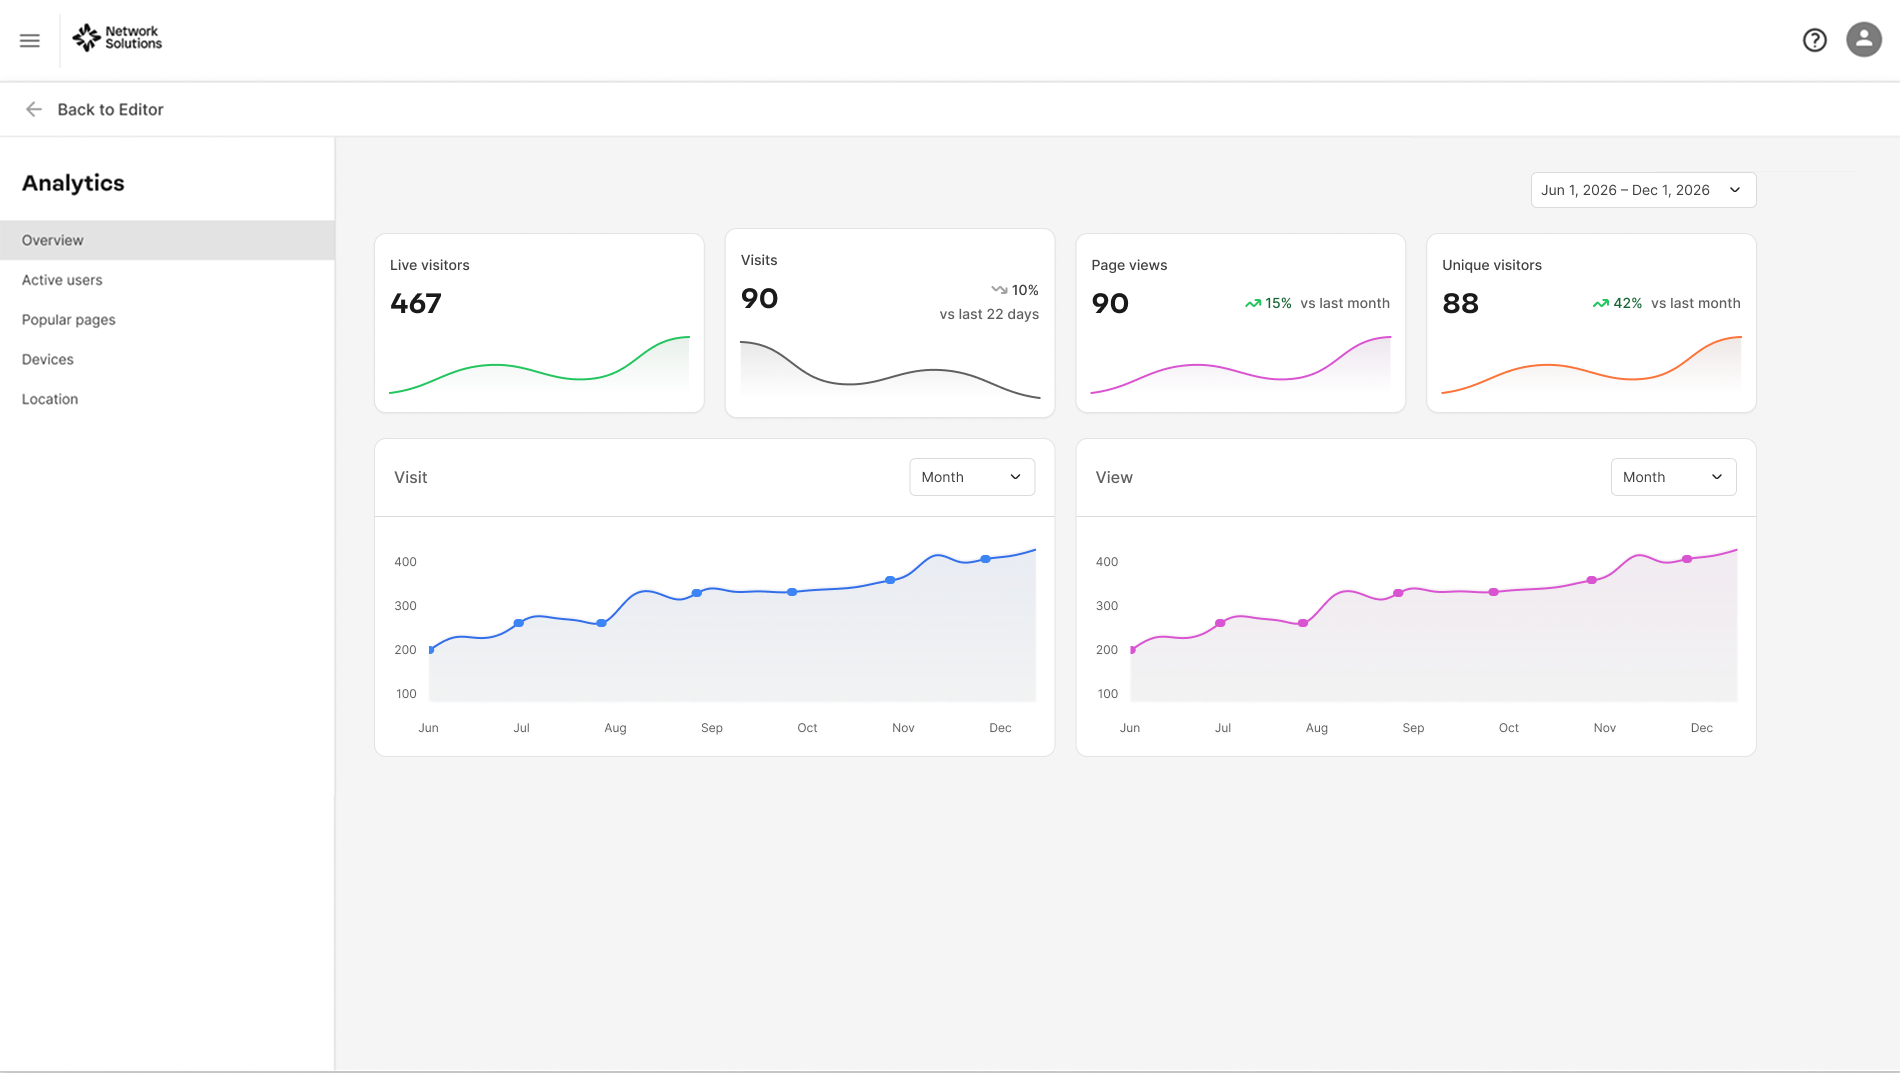
- Live Visitors. This graph displays the number and trend of live visitors on the published site. The Live Visitors graph is updated every minute.
- Visits. The Visits graph at the top displays the number of visits to your website during the day. You can adjust the main Visits section at the bottom to display the dynamics of your website's latest visitors within the selected date range. Trend indicators show whether visits increased (green) or decreased (gray) compared to the previous time period.
- Page Views. The Page Views graph at the top displays the total number of visitors' page views, including multiple visits by the same person. Trend indicators highlight upward or downward changes compared to the previous period.
- Unique Visitors. The Unique Visitors graph displays aggregated data on how many individuals visited the published website. The dynamics of this value represent the new audience reach of the website. Trend indicators reflect growth or decline compared to the previous period. You can now quickly switch between predefined time periods (last 24 hours, 7 days, 30 days, 90 days, last year). Custom date range selection is still available via the calendar for more detailed analysis.
Active Users Tab
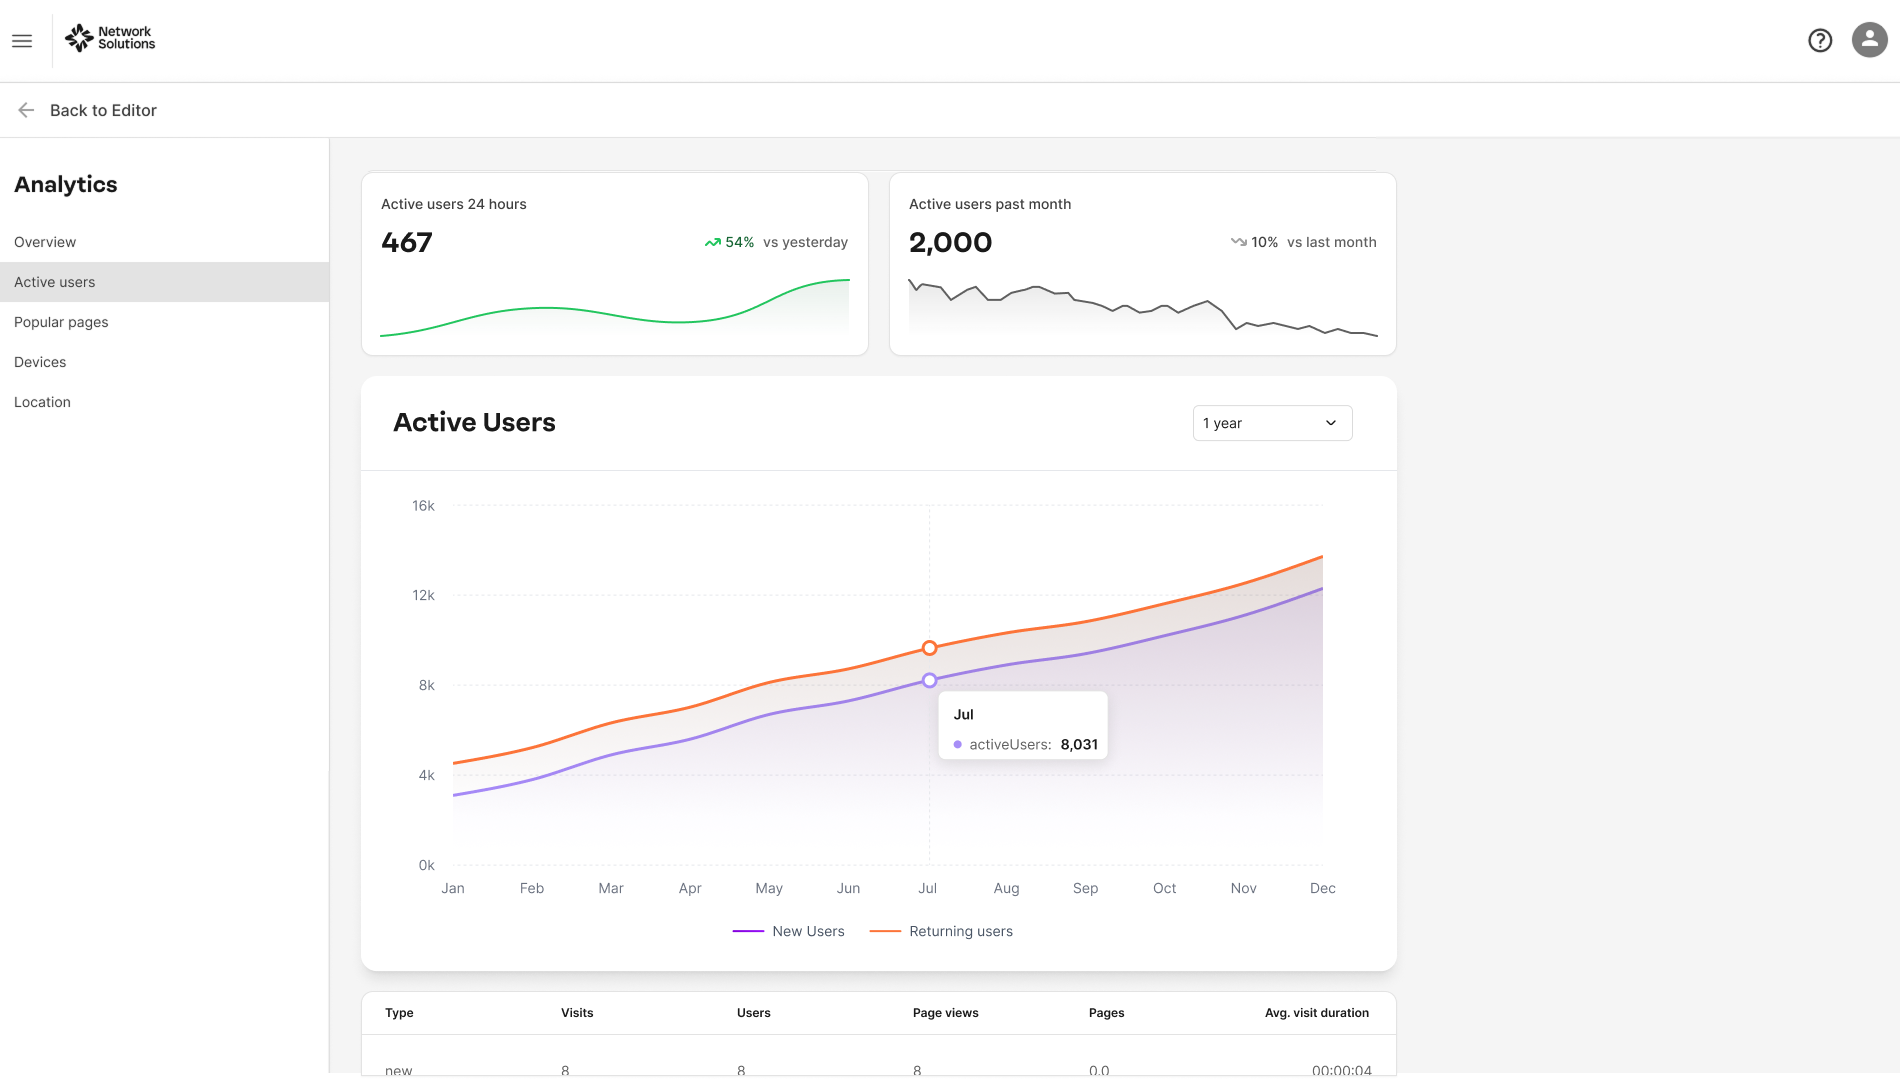
Displays the number of new and returning users currently engaging with your website in real-time or over a specified period. This tab helps you monitor user activity trends, peak usage times, and overall engagement levels. You can use predefined time filters (last 24 hours, 7 days, 30 days, 90 days, last year) and custom date range selection.
Popular Pages Tab
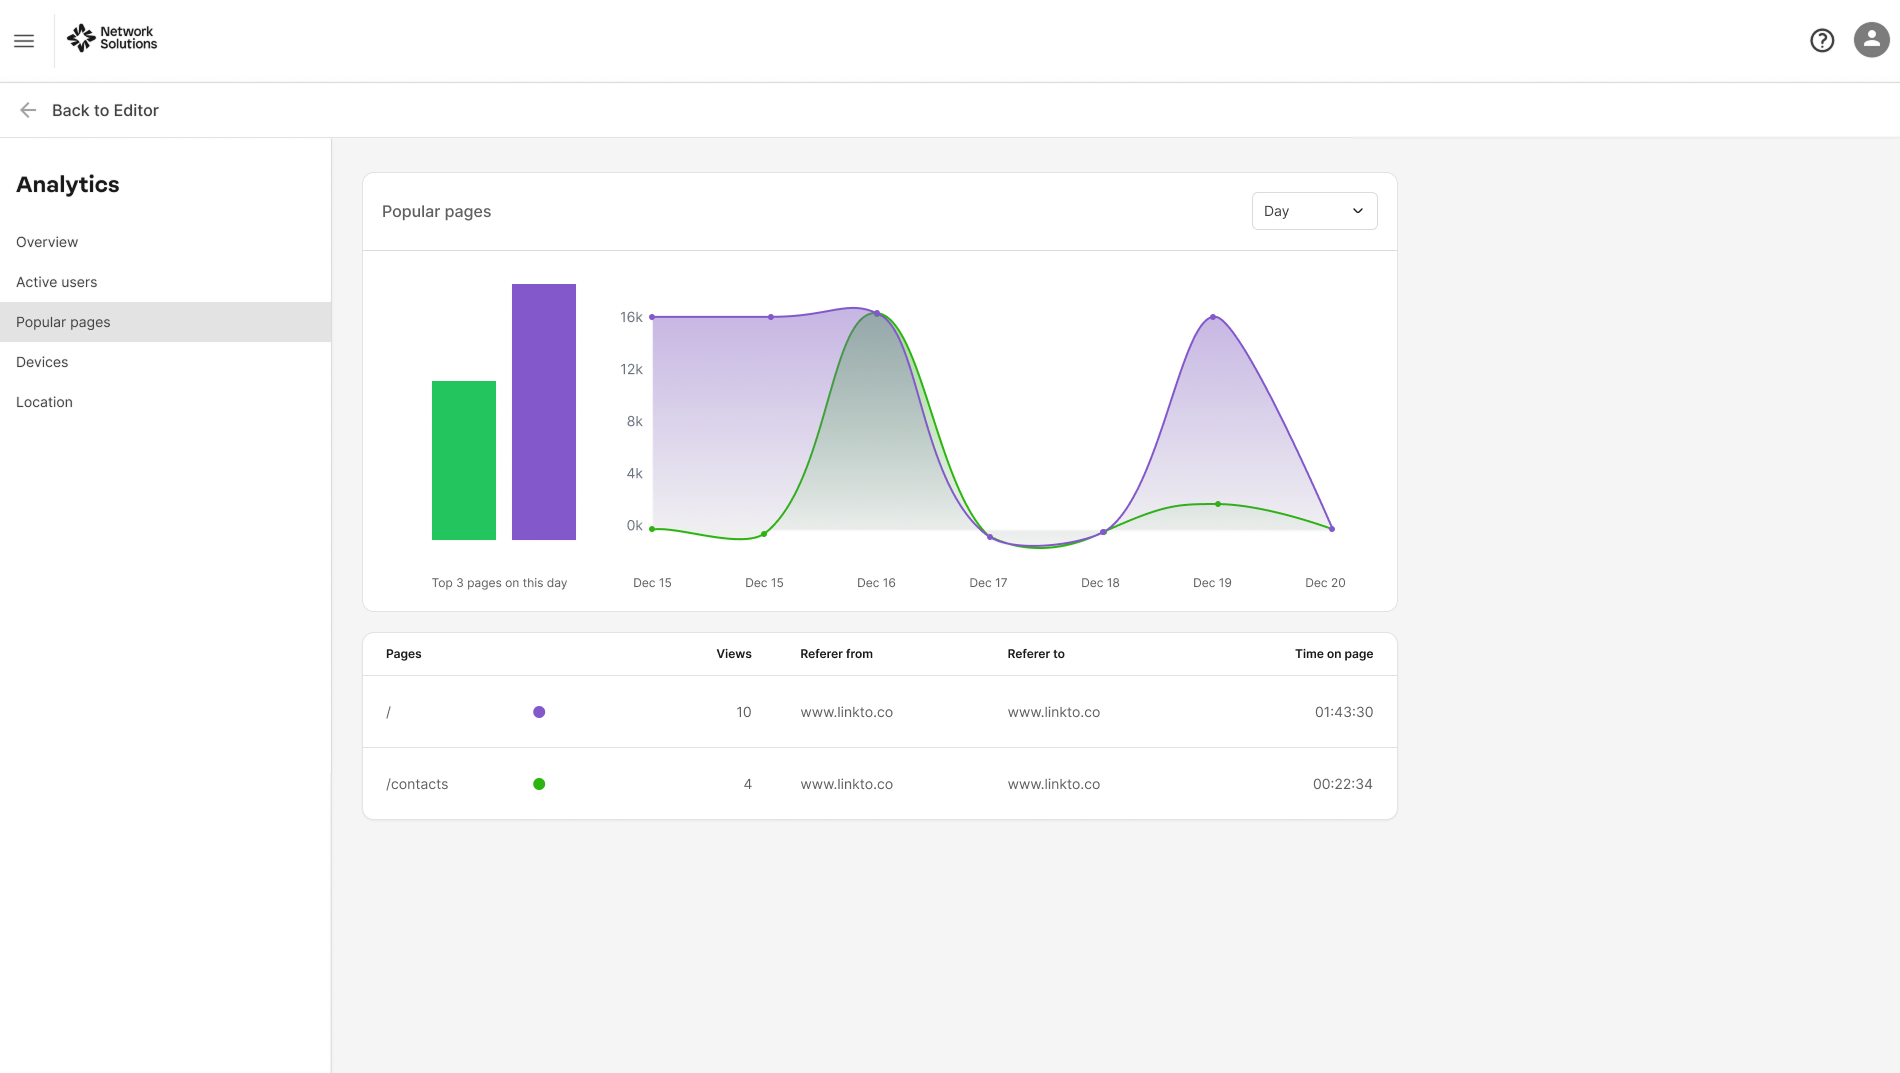
Shows which pages on your website receive the most visits. This tab helps identify content that attracts the most attention, allowing you to understand user interests and optimize your site’s structure and content strategy. You can use predefined time filters for quick analysis, with the option to select a custom date range.
Devices Tab
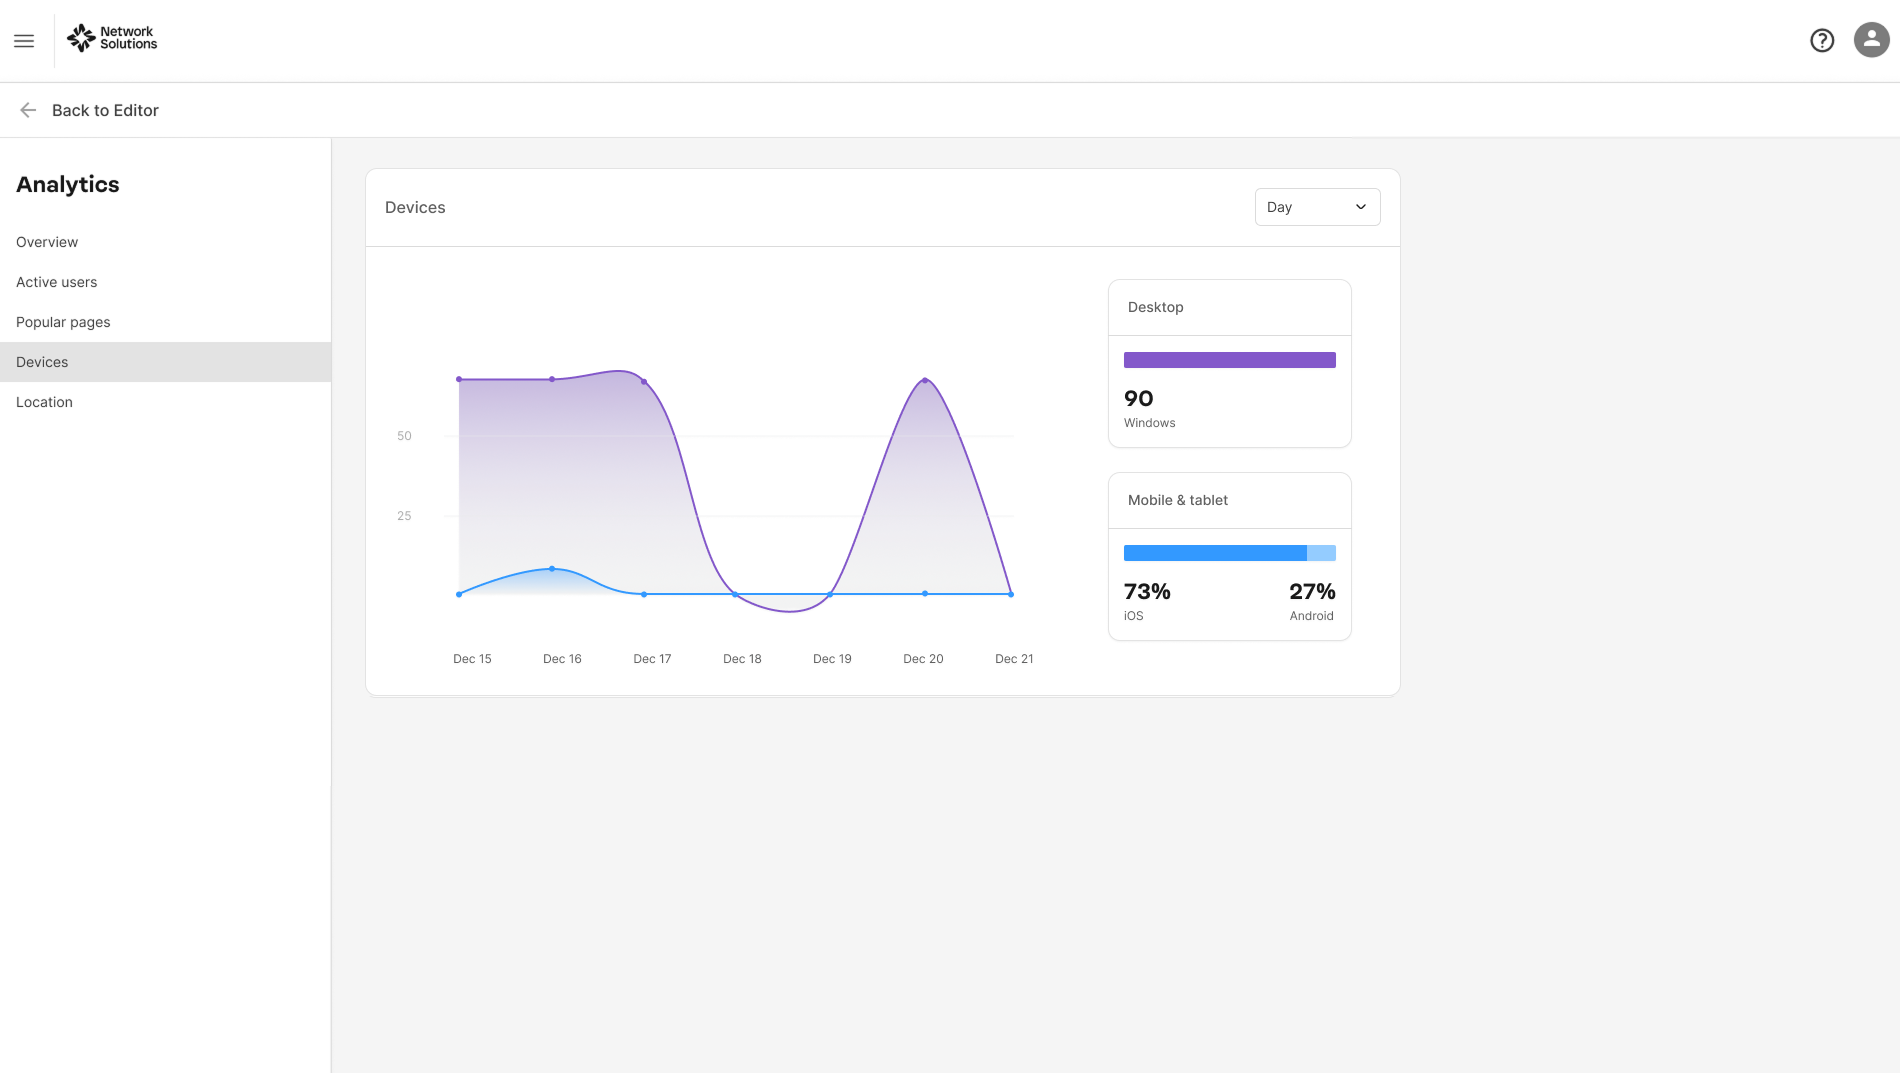
Breaks down user sessions by device type, such as desktop or mobile. This tab helps you understand how your audience accesses your platform, enabling you to tailor user experience and design for different devices. You can use predefined time filters and custom date range selection for analysis.
Location Tab
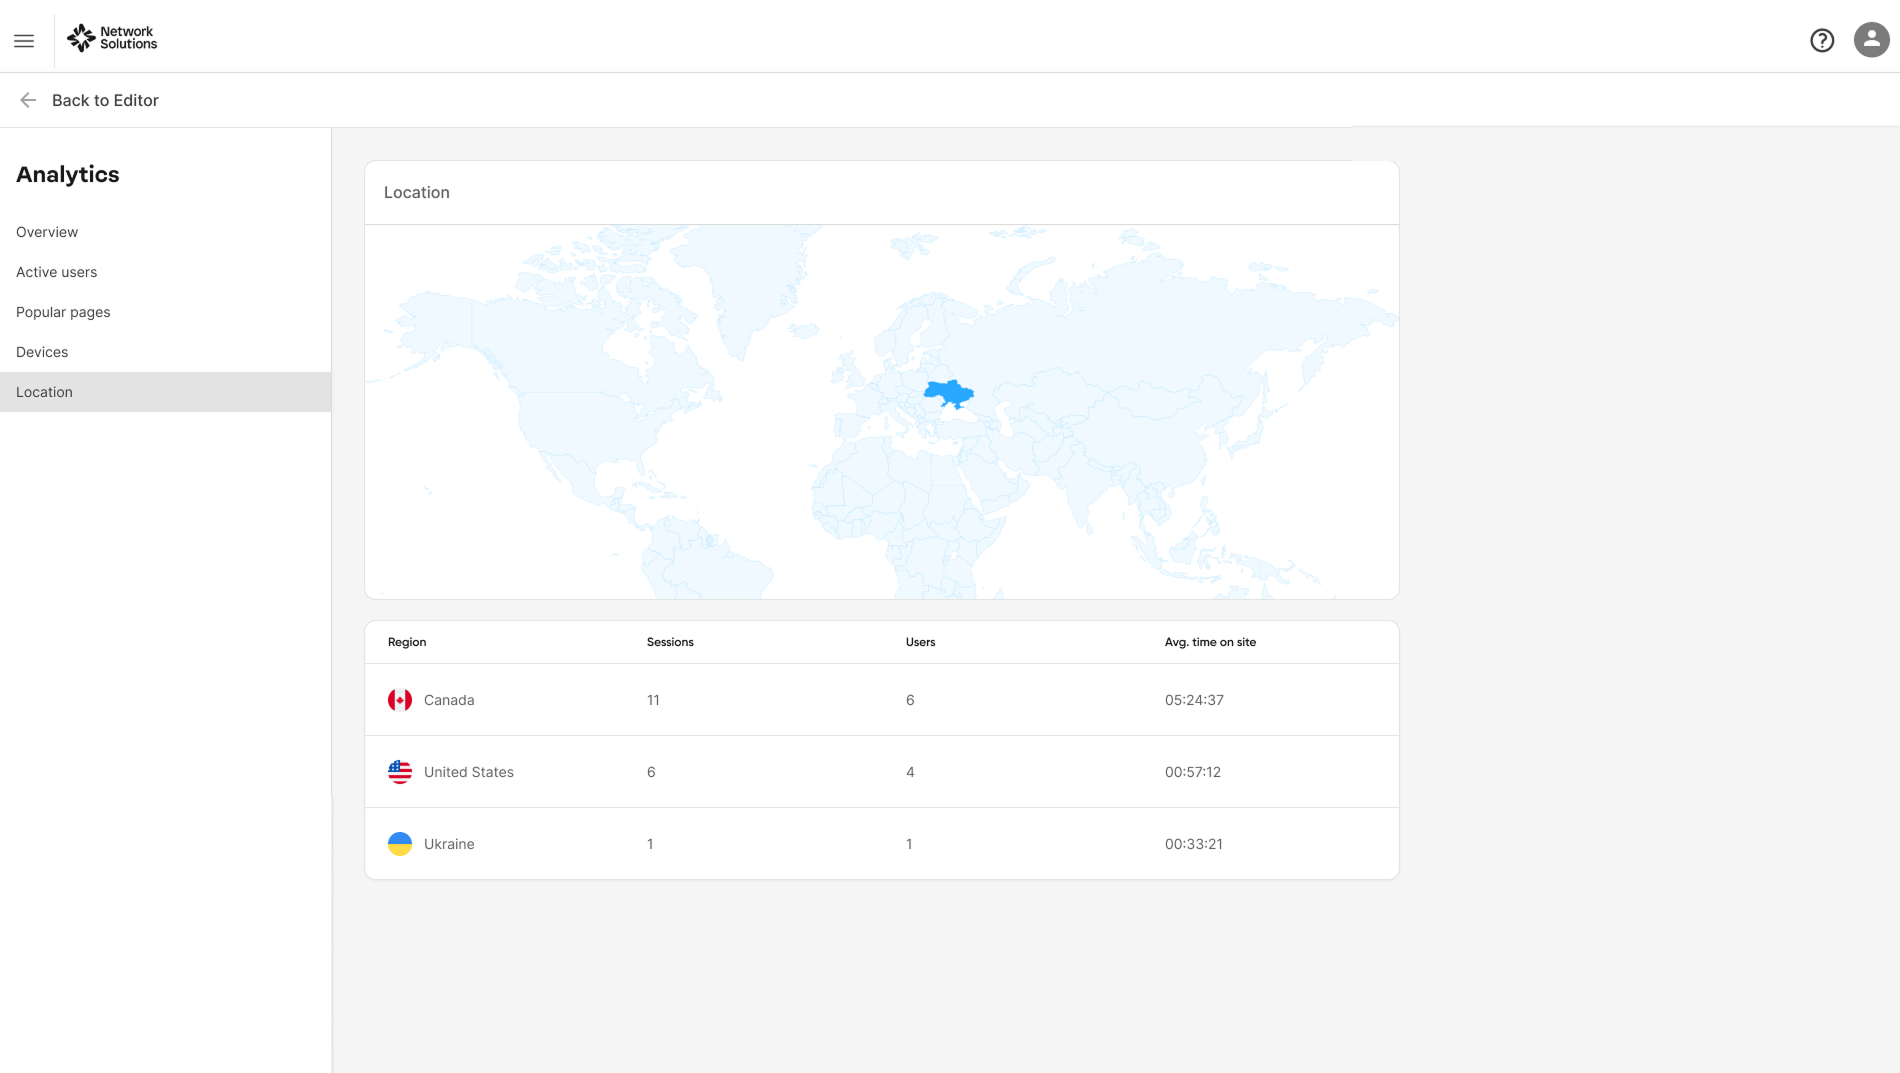
Provides insights into the geographic regions from which your users are accessing your site. This tab helps identify key markets and regional trends, supporting targeted marketing and localization efforts. You can use predefined time filters and custom date selection for flexible analysis.
Enabling Analytics Tool in the Website Builder
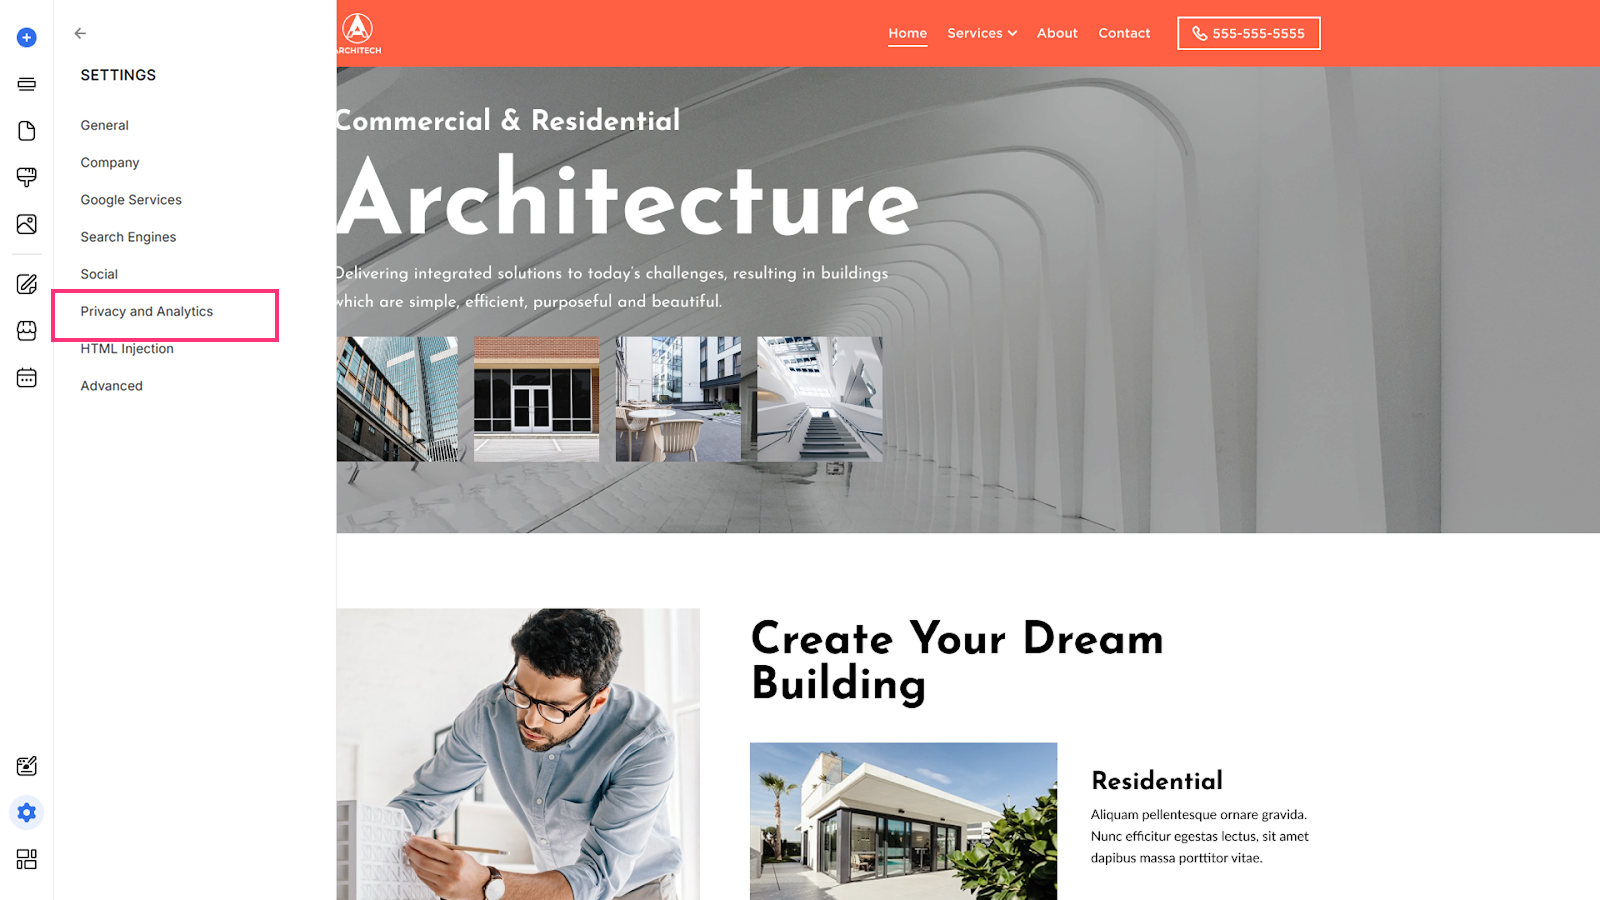
The Analytics tool is enabled by default upon the site creation. To check your Analytics tool status or turn it off, please follow the next steps:
- Proceed to Settings in the Website Builder, and select Privacy and Analytics:
- To turn the Analytics tool off, disable the Website Analytics toggle: